Contents:
Electricity prices in many regions have risen faster than inflation, while rooftop solar module efficiency and reliability have improved. Netting policies and self-consumption economics continue to reward behind-the-meter generation. For homes and businesses, solar is no longer an exotic upgrade; it’s a rational energy asset. The key question is not whether to go solar, but how to select the right module and system so that lifetime production, warranty coverage, and cash flows meet expectations.
-
Energy prices and policy context: Wider peak/off-peak spreads and evolving netting mechanisms increase the value of daytime generation and load shifting.
-
Growing demand for clean energy: Electrification (EVs, heat pumps, data-heavy lifestyles) pushes annual kWh and peak kW upward, making on-site PV a practical hedge.
-
Maturity and cost baseline: High-efficiency cell architectures (TOPCon, HJT, IBC) have moved into mainstream volume, while BOS and installation practices have standardized.
Solar Panel Types and Core Differences
Principles and characteristics
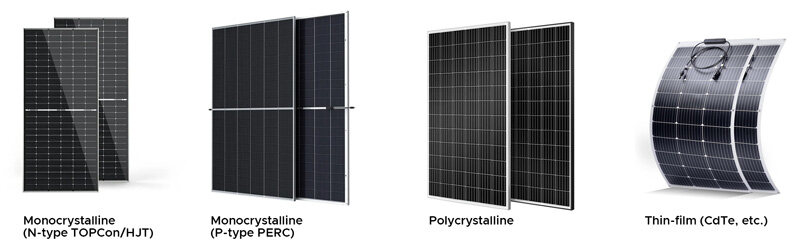
Monocrystalline modules deliver the highest efficiency and power density; N-type TOPCon/HJT variants usually feature better high-temperature performance and slower degradation. Polycrystalline modules once dominated on cost but have largely been displaced by mono; they still suit budget-first projects. Thin-film (e.g., CdTe, a-Si) offers lower nameplate efficiency but attractive temperature behavior and shading tolerance, especially in hot climates or façade applications.
Side-by-side comparison
Indicative ranges; confirm with current datasheets and local pricing.
|
Type
|
Typical Module Efficiency
|
Temperature Coefficient (Pmax)
|
Degradation (Year 1 / Annual Thereafter)
|
Indicative Module Cost ($/W)
|
Best Fit
|
Notes
|
|
Monocrystalline (N-type TOPCon/HJT)
|
21–24%
|
−0.26% to −0.30%/°C
|
~1.0% / 0.25%
|
0.22–0.40
|
Limited roof area, premium yield
|
Highest power density; strong low-light behavior
|
|
Monocrystalline (P-type PERC)
|
20–22%
|
−0.34% to −0.38%/°C
|
~2.0% / 0.45%
|
0.18–0.32
|
Balanced CAPEX/performance
|
Widely available, proven track record
|
|
Polycrystalline
|
17–20%
|
−0.38% to −0.42%/°C
|
~2.0% / 0.50%
|
0.16–0.28
|
Cost-sensitive projects
|
Lower power density; less common in new builds
|
|
Thin-film (CdTe, etc.)
|
10–16%
|
−0.18% to −0.28%/°C
|
~1.0% / 0.35%
|
0.20–0.35
|
Large arrays, hot climates
|
Strong high-temp performance; lower kW/m²
|
Climate performance differences
In hot climates, a lower (less negative) temperature coefficient preserves output on scorching roofs. In low-light or hazy conditions, HJT/IBC and some thin-film maintain proportionally higher yield. For snow/wind exposure, check mechanical load ratings, glass thickness, and frame design.
Key Performance Indicators Explained
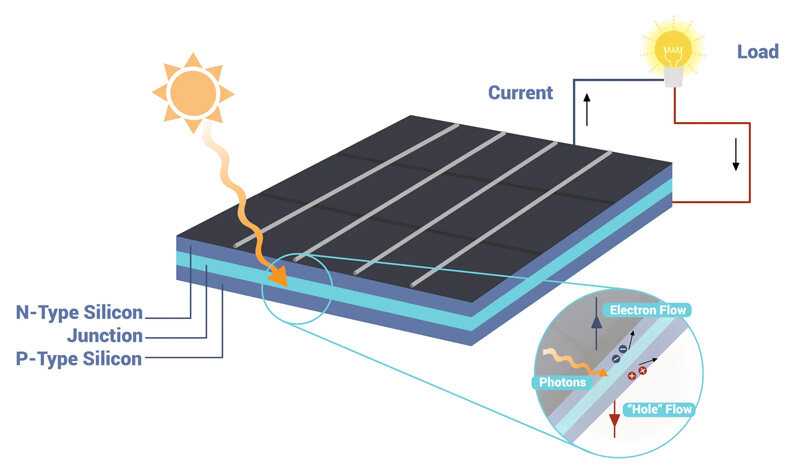
Solar Panel Conversion Principle Diagram
Conversion efficiency
Efficiency determines energy per unit area. For constrained rooftops, moving from 20% to 22.5% can materially increase annual kWh without expanding the footprint.
See also: How the Number of Cells in Solar Panels Affects Efficiency?
Power (Wattage) and size matching
Start from 12 months of kWh, your target self-consumption ratio, and usable roof area. Translate area into module count, then check DC/AC ratio, stringing constraints, and inverter loading. Model clipping in peak seasons to understand real yields.
Temperature coefficient
A smaller temperature coefficient means less output loss on hot days. This is essential for dark roofs with limited airflow.
Degradation rate
Expect ~1–2% first-year loss and ~0.25–0.45% annually thereafter. Over 25 years, small differences compound into significant lifetime yield gaps.
Warranty and certifications
Product warranties often span 12–25 years; performance warranties guarantee a minimum power percentage after 25–30 years. Look for IEC 61215/61730, UL 61730, and third-party lab data to validate claims.
Long-term power retention
Brand and Technology Selection
Use this table to shortlist vendors by cell architecture, warranty strength, and flagship series. Always confirm current datasheets and regional availability.
|
Brand
|
Primary Cell Tech
|
Flagship Series
|
Typical Power Class
|
Product Warranty
|
Performance Warranty (25–30y)
|
Notes
|
|
SunPower (Maxeon)
|
IBC (N-type)
|
Maxeon 6/7
|
400–470 W
|
25 yrs
|
≥92–93% @25y
|
Premium efficiency, robust PID/LID resistance
|
|
LONGi
|
TOPCon (N-type)
|
Hi-MO X/9
|
400–600+ W
|
15–25 yrs
|
≥89–90% @25y
|
Broad channel support, strong bankability
|
|
Jinko Solar
|
TOPCon (N-type)
|
Tiger Neo
|
400–600+ W
|
15–25 yrs
|
≥89–90% @25y
|
High volume, competitive pricing
|
|
Trina Solar
|
TOPCon (N-type)
|
Vertex S/V
|
400–600+ W
|
15–25 yrs
|
≥89–90% @25y
|
Proven field performance
|
|
JA Solar
|
TOPCon (N-type)
|
DeepBlue/Uni
|
400–600+ W
|
15–25 yrs
|
≥89–90% @25y
|
Strong utility and C&I presence
|
|
Canadian Solar
|
TOPCon / HJT
|
HiHero/HiKu
|
400–600+ W
|
15–25 yrs
|
≥89–90% @25y
|
Balanced value and support
|
|
First Solar
|
Thin-film CdTe
|
Series 6/7
|
Utility scale
|
10–12 yrs
|
≥87–90% @30y
|
Utility-grade, hot-climate strengths
|
Selection tips: match climate to temperature coefficient and degradation; filter by warranty floors that align with your LCOE target; verify mechanical load, fire rating, and BOS compatibility.
System Matching and Installation Considerations
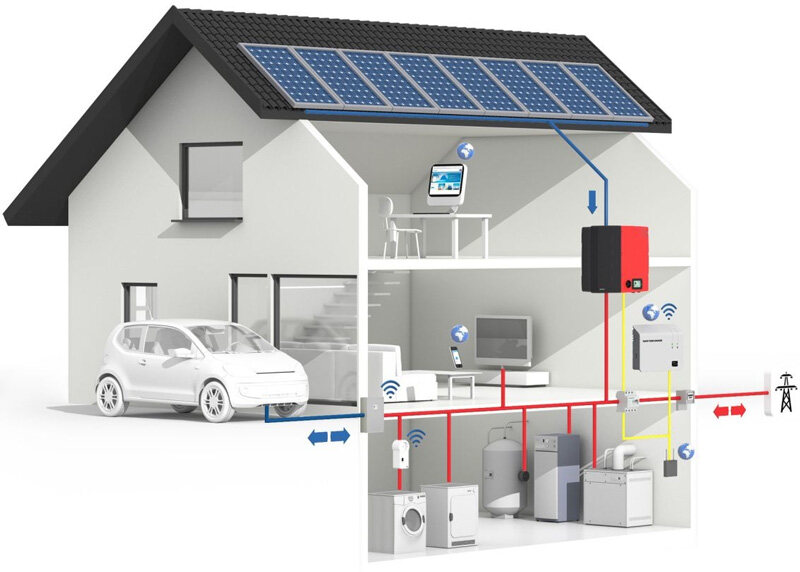
Solar System Installation Diagram
Inverter selection
String/central inverters suit unshaded, uniform arrays. Microinverters deliver panel-level MPPT for complex roofs and partial shading. DC optimizers offer panel-level optimization with centralized conversion.
Racking, orientation, and tilt
Optimize azimuth and tilt for your latitude and load profile. Small tilt deviations rarely kill yield, but shading does—model seasonal shading windows carefully. Confirm structure, attachment methods, and corrosion class.
Storage and interconnection mode
Grid-tied systems maximize self-consumption and TOU savings. Hybrid systems with batteries add resilience and peak shaving; size kWh to cover evening peaks and critical loads. Off-grid designs must handle worst-case resource and surge loads.
Installation quality and O&M
Verify installer credentials, workmanship warranty, and safety practices. Plan periodic inspections (visual, electrical, and, for larger arrays, IV-curve sampling), and adopt a cleaning policy tied to measured soiling losses.
Economics and Investment Return
Cost structure
Module, inverter, racking, BOS, labor, permitting/interconnection. Add storage only when it materially improves TOU economics or resilience value.
Incentives and tariffs
Map federal/state/local incentives, property tax treatment, and netting constraints. Update these assumptions annually.
ROI and production example
Example assumptions: fixed-tilt roof, average irradiance site, self-consumption priority, time-of-use savings included in “Annual Savings.” Replace with your local numbers.
|
System Size
|
Turnkey Cost (USD)
|
Year-1 Production (kWh)
|
Annual Savings (USD)
|
Simple Payback (yrs)
|
|
5 kW
|
9,000
|
7,200
|
1,150
|
7.8
|
|
10 kW
|
15,500
|
14,500
|
2,250
|
6.9
|
|
50 kW (C&I)
|
68,000
|
74,000
|
11,500
|
5.9
|
Cumulative cash flow over time
FAQs
How do microcracks or cell damage affect long-term panel performance? +
Even small microcracks can increase electrical resistance and reduce current flow between cells, leading to localized hot spots and gradual yield loss. Modern modules mitigate this with multi-busbar or shingled layouts that distribute stress. Buyers should request EL (electroluminescence) test reports from suppliers to verify that panels are free of hidden cracks before installation.
What role does bifacial technology play in residential or commercial installations? +
Bifacial modules capture reflected and diffuse light from both sides, boosting total energy yield by 5–20% depending on surface albedo and mounting height. In 2026, bifacial N-type TOPCon and HJT panels are increasingly common not only in utility plants but also in ground-mount C&I systems. For rooftops, ensure proper rear-side clearance and light-colored surfaces to gain measurable benefit.
How important is potential-induced degradation (PID) and light-induced degradation (LID) resistance? +
PID and LID are subtle but cumulative efficiency losses caused by voltage stress and light exposure. Modules certified as PID-free or low-LID—especially those using N-type wafers—maintain more stable output over decades. Always check whether the module datasheet lists PID/LID testing per IEC 62804 and manufacturer-specific accelerated aging tests.
What monitoring systems and data analytics should be included in a 2026 solar setup? +
Modern PV systems often integrate module-level monitoring, weather-compensated performance ratios, and automated fault detection. A robust platform should offer inverter-API integration, cloud-based dashboards, and alert thresholds for string mismatch or inverter downtime. For commercial projects, AI-driven predictive maintenance reduces unplanned outages and improves O&M ROI.
How can owners evaluate environmental impact and supply-chain sustainability? +
Beyond energy output, 2026 buyers increasingly consider embodied carbon and recycling pathways. Look for panels with Environmental Product Declarations (EPDs), ISO 14001-certified manufacturing, and compliance with the EU’s upcoming PV sustainability directive. Choosing modules with recyclable aluminum frames and lead-free solder can lower total lifecycle emissions and ease end-of-life recovery.